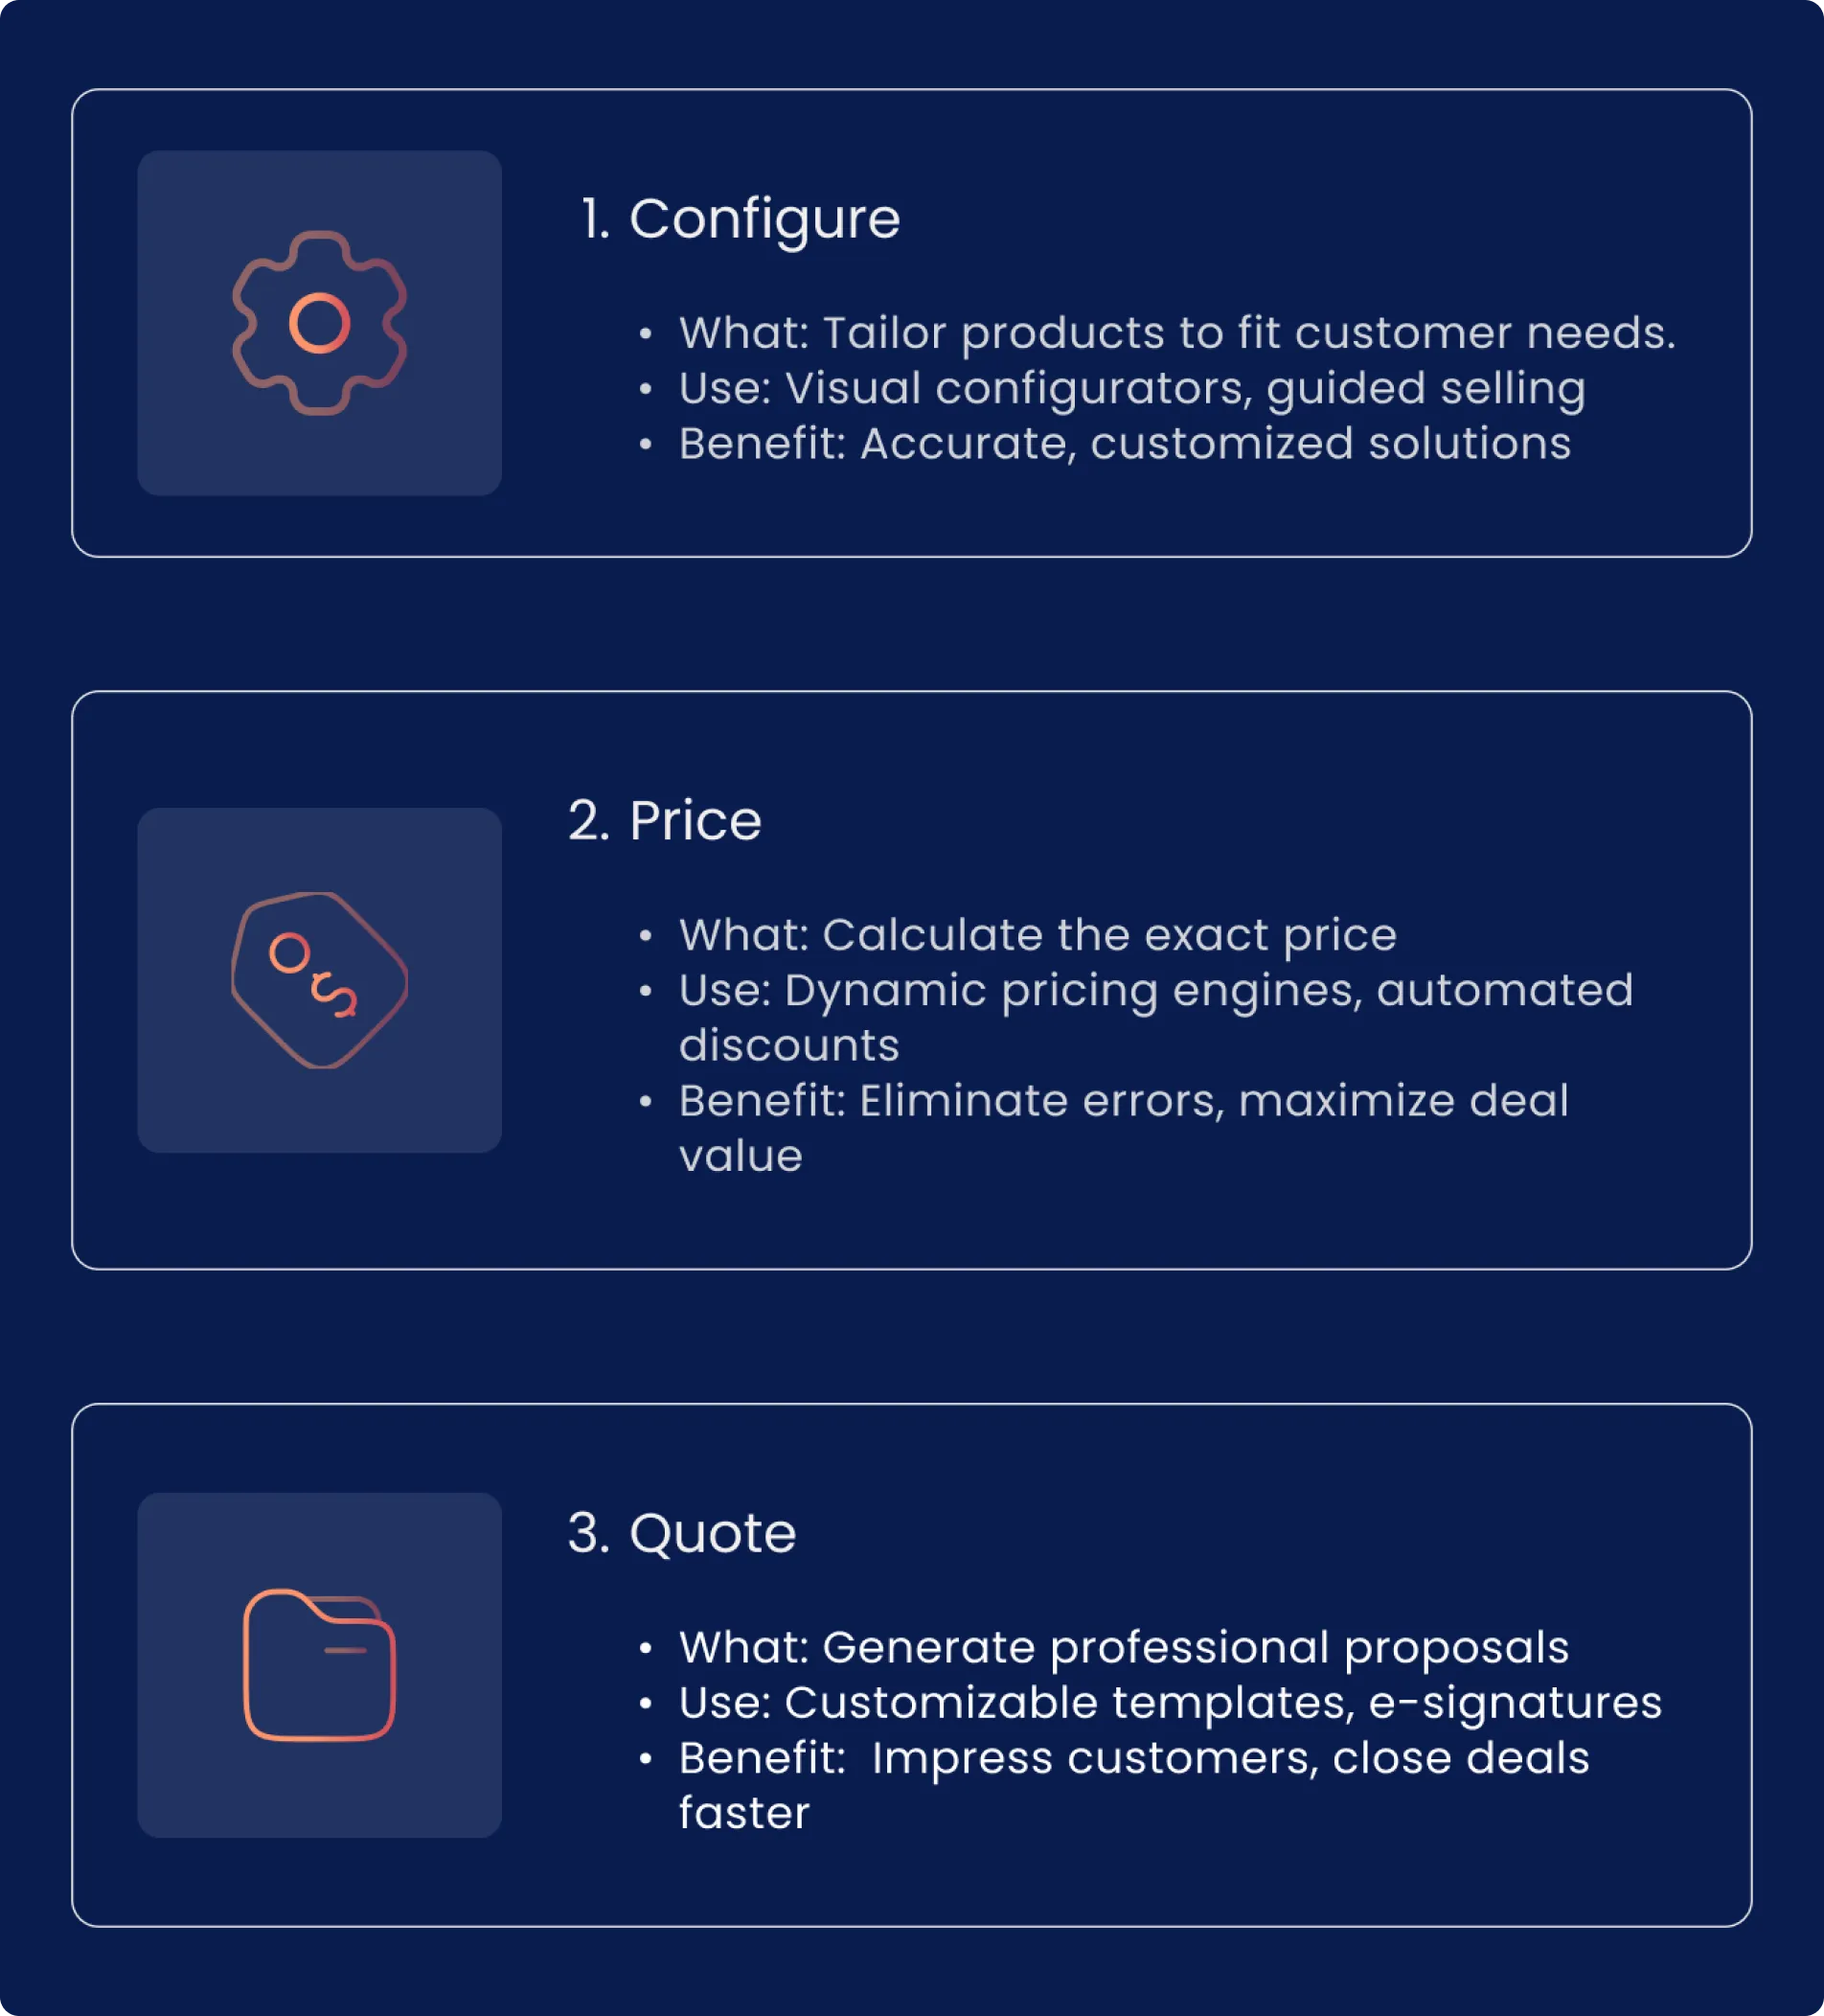
- Features > Configuration Insights


Configuration Insights
Analyse how products are being configured across your entire customer base. Surface the most popular option combinations, identify stalled configurations, and use real demand data to guide product development.
Every option
Selection tracked and analysed
Real demand
Not forecast — actual selection data
Product + sales
Teams aligned on real customer preference
The challenge
Product Teams Are Making Portfolio Decisions Without Demand Data
Product managers responsible for manufacturing portfolios make critical decisions about which variants to develop, which options to retire, and which configurations to promote — typically based on sales team feedback, customer surveys, or historical order data. None of these sources reflects how customers are actually exploring and configuring products today.
Order data shows what customers bought. Configuration data shows what customers wanted — including options they explored but ultimately did not purchase, configurations they started but did not complete, and combinations they attempted that were blocked by validation rules.
This gap between purchase data and exploration data is where the most valuable product intelligence lives. An option that is frequently explored but rarely purchased may indicate a pricing problem, a UX problem, or a genuine product-market fit issue — each requiring a different response.
Without systematic configuration analytics, product teams miss these signals entirely and continue to invest based on incomplete information.

How it works
How Configuration Insights Work in Mercura
Mercura captures structured data for every configuration session — every option selected, every option changed, every step where a user paused or abandoned the configuration, and every completed configuration that resulted in a quote. This data is aggregated into configuration insights dashboards organized by product family, option category, and customer segment. Most-selected options, most-abandoned options, and most-common completed configurations are presented as ranked lists and trend charts. Product managers can filter by time period, customer tier, and sales channel to understand how configuration behavior varies across segments.
What's included
Key Capabilities
- Option frequency analysis — ranked list of most and least selected options
- Configuration abandonment tracking — identify where users drop out of the process
- Most common completed configuration combinations for each product
- Blocked combination frequency — reveal options customers want but rules prevent
- Customer segment comparison — how enterprise and SMB customers configure differently
- Time-series trend analysis for demand shifts in specific options
- Channel comparison — how dealer-configured and direct-configured products differ
- Export to product management tools for roadmap planning
The difference
Before and After Configuration Insights
- Product decisions based on historical orders — not on current demand
- Configuration abandonment invisible — product team unaware of user friction
- Blocked combinations unknown — demand suppressed by rules that could be relaxed
- Option retirement decisions made without frequency data
- Customer preference by segment invisible — one-size product strategy applied
- Product decisions informed by real configuration demand data
- Abandonment patterns surface user experience and product gap signals
- Frequently blocked combinations flagged for rules review and possible enablement
- Option frequency data drives evidence-based portfolio rationalisation
- Segment-specific configuration patterns enable tailored product strategies
Real-world application
Example Use Case: Motion Control Equipment Manufacturer
A motion control equipment manufacturer discovered through Mercura's configuration insights that a specific combination of encoder type and communication protocol was being selected and then abandoned in 34% of all configuration sessions where it was attempted. The product team had assumed the combination was rarely needed. The data revealed it was frequently desired but difficult to complete due to confusing option sequencing in the configurator. A UX change to the configuration flow reduced abandonment for this combination by 80% and increased quotes for that specification by 27% over the following quarter — representing a meaningful pipeline increase from a change that cost nothing to implement.
Quote turnaround dropped from 3 days to under 4 hours.
Business impact
Why Configuration Insights Matter
Configuration data is the most direct signal of customer product intent available to a manufacturer. It shows not just what customers bought but what they wanted — at the moment of wanting it, with the granularity to understand exactly which options and combinations they were seeking. Mercura configuration insights make this data continuously available to the product teams who can act on it, transforming the CPQ system from a transaction engine into a strategic product intelligence platform.
See What Your Customers Are Actually Configuring
Book a demo to see how Mercura configuration insights give product teams the demand data they need to build the right products.
Let’s build together.
We empower manufacturers to master product modeling, streamline quoting process, reduce errors, and ultimately deliver the tailored solutions that customers demand.